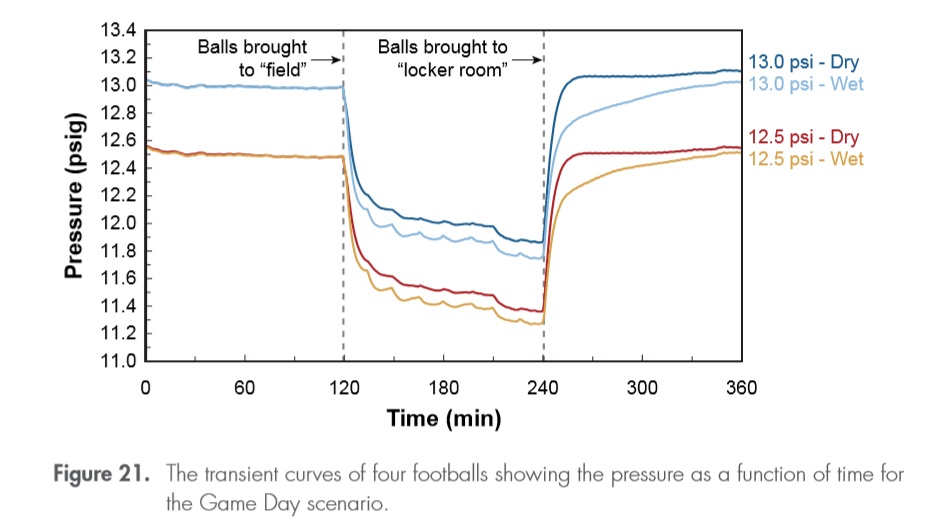
This is the wet/dry graph that is from the Wells' Report. If you click on it you will go to a PDF of the Wells' Report.
So, I'm finally finished reading the appeal. After reading that I went back and looked over the Wells' Report. Now with a little bit of time on my hands I'm going to point out a few issues I have with the data and graphs from good ole Ted. While I could ramble on and on about how ridiculous the report is, especially now that they are finally admitting that it wasn't really independent. However, I try to be original with my posts. If you aren't into reading much right now, at least take a peak at what I do to the graph above.
In my opinion the wet/dry graph from above is very deceiving. Besides the fact that the wet/dry data comes from a total of 4 footballs (one wet and one dry one for both teams). The following is the direct quote from page 202 of the Wells' Report for how the data was collected.
- The transient pressure and temperature gauge described above was used to generate the data shown in the plot shown in Figure 21. The Master Gauge was used to set the pressure of two footballs at 12.50 psig, representing the reported pre-game pressure for the Patriots footballs, and to set the pressure of two other footballs at 13.00 psig, representing the reported pre-game pressure for the Colts footballs. From each team’s set of two footballs, one ball remained dry whereas the other was wet.36 The footballs were allowed to sit at a temperature of 69°F for 2 hours to approximate the conditions in the shower area of the Officials Locker Room. They were then exposed to temperatures of 50°F for 1.5 hours, followed by 30 minutes at 48°F, all while at approximately 75% relative humidity. These changes were meant to approximate the conditions the footballs were exposed to on the field during the first half. They were then exposed to a temperature of 72–73°F and approximately 20% relative humidity (which represents an approximation of the temperature and relative humidity in the Officials Locker Room at halftime) for 2 hours.
Now one of the major things that I dislike about this graph is how they've extended it out a full two hours while making it pretty difficult to get a grasp of when the halftime measurements would be occurring. Because of that issue I decided to draw a few extra lines onto the original graph.
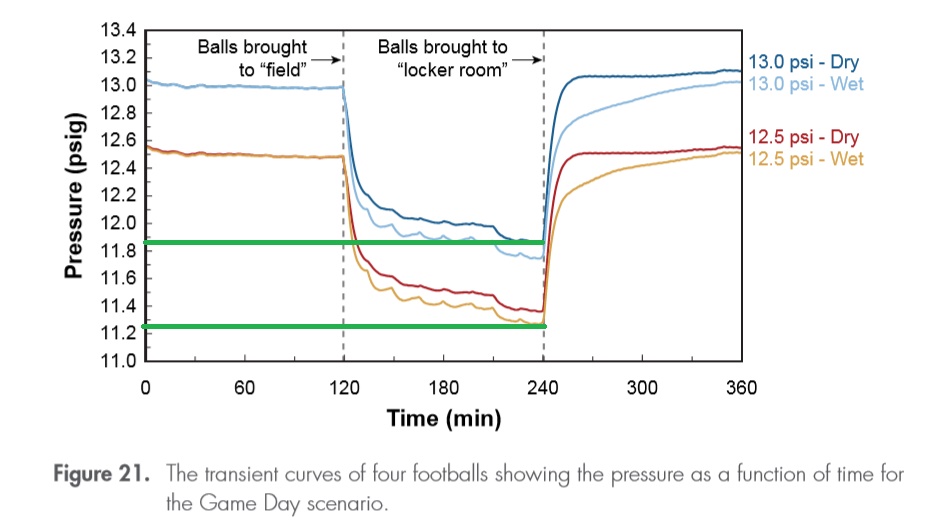
The first thing I did was simply draw lines back to the measurements. Yes, I went with the wet Patriots' ball and the dry Colts' ball.
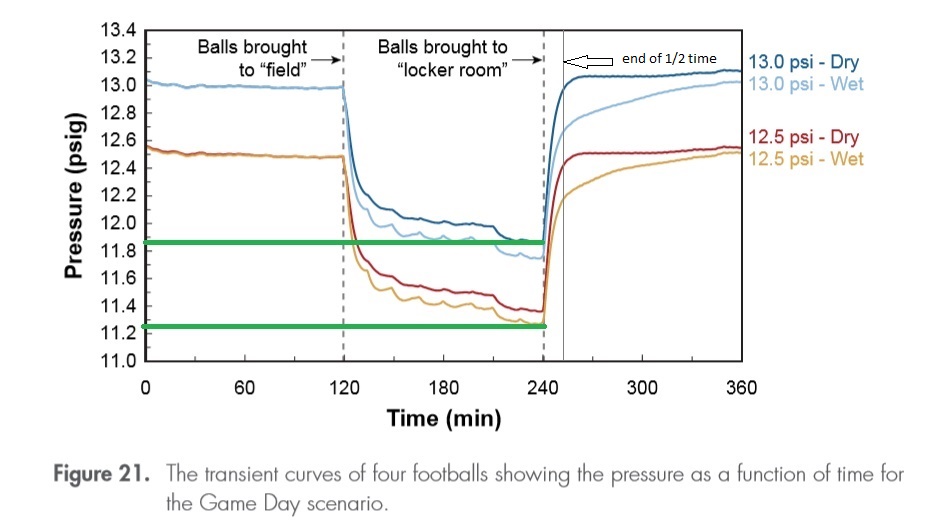
Next I added in a line showing where halftime would end. If you didn't quite get why I didn't like the fact that the graph drags out for two hours, maybe that helps. Of course I would like to have all the raw data and maybe more than one sampling of data.
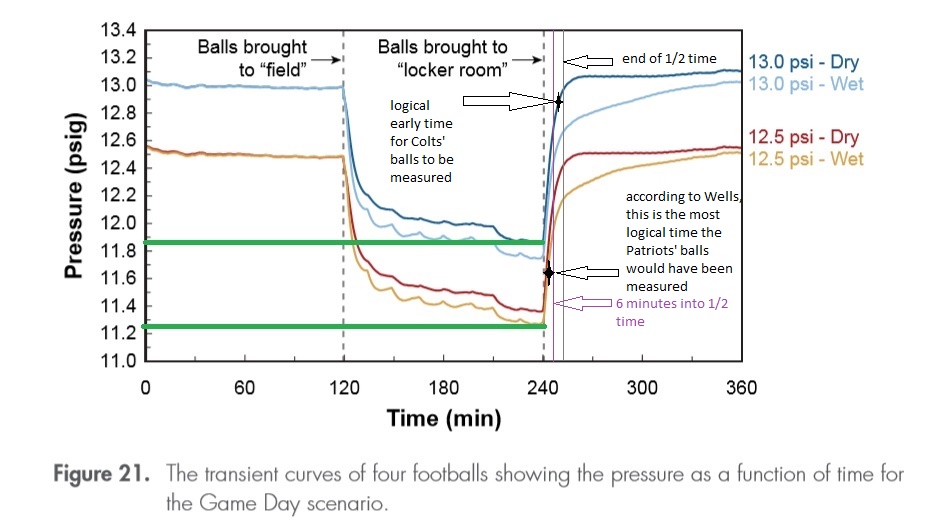
With this next graph I added in a few markings. First the purple line to show the halfway point of halftime. Next I marked the data point which is likely to correspond with the assumptions Wells' has made in his report regarding when both teams would have likely had their footballs measured. Looking at it this way it is evident that the Patriots' footballs would still be very low while the Colts' footballs would be almost back to normal.
Below you will see that I included the measurements from halftime. This is the version of how the data was actually recorded. Eventually, it was decided that some gauges must have switched users and data was written down wrong. So, from this point on we are assuming low readings in one column and high readings in the other. In other words this really important data was written down like a kid copying someone's homework before the bell rings, little attention to detail.
Below you will see that I included the measurements from halftime. This is the version of how the data was actually recorded. Eventually, it was decided that some gauges must have switched users and data was written down wrong. So, from this point on we are assuming low readings in one column and high readings in the other. In other words this really important data was written down like a kid copying someone's homework before the bell rings, little attention to detail.
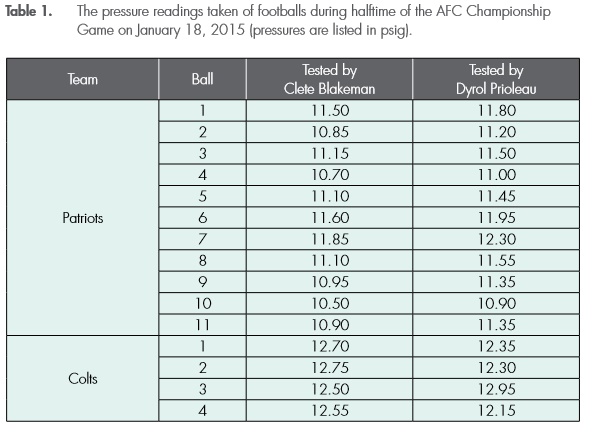
In addition to supplying the game day measurement to show their carelessness, I also wanted you to have quick access to these numbers as you look at the graphs from above. While the graphs from the Wells' report are a bit difficult to read and in my opinion should have had additional tests (at least 3 balls for each situation), the game day data does appear to go along with what is expected. While the numbers for the Patriots may have been a little lower than the simulation numbers, some balls may have been a lot wetter than others. Moreover, this simulation completely disregards the fact that the umpires may have completed their pre-game measurements (if they actually occurred) while the footballs were still "hot" from their rub downs. If you go to page 104 (399) of the appeal Caligiuri states that during the rubbing experiment Exponent did it took the footballs 30-40 minutes to come back down to normal. But hey, that's irrelevant.
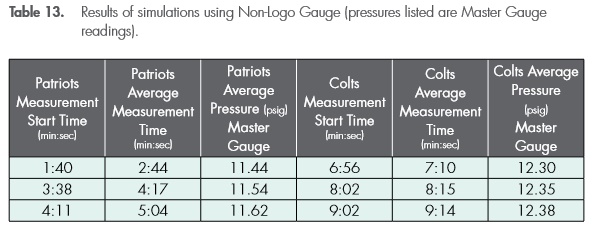
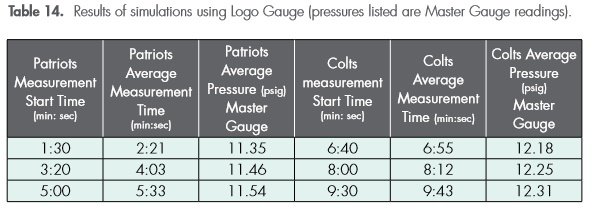
Okay the last bunch of data I'm busting out before wrapping up this post comes from pages 218 and 219 of the Wells Report. This is where Wells tries to show that while time is a factor, it surely can't be the reason that the Patriots' PSI was significantly lower than the Colts'. Now while we almost have raw data (these averages are slightly easier to read than the graph), the fact that Exponent moistened both teams' footballs equally, it isn't very accurate.
While the data isn't super useful, I did include it for two reasons. One is that it actually gives you some numbers to look at instead of getting a migraine imagining the numbers on the graph. The other is because it once again shows how Exponent is just not accurate with things. According to Wells, the most likely time the Patriots' footballs were measure is at the 3 minute mark. He did this experiment to show the timing factor. His unrealistic start time was 1.5 minutes, realistic time was 3 minutes, and unrealistic late start was 4 minutes. Come on, this study cost 5 million dollars and you can't even start the measurement time at the 3 minute mark?
Now that we all know that the investigation was not independent, how can anyone look at the data and conclude that something nefarious occurred. Exponent was paid to show that Brady and friends did something to the footballs after they were measured by the referees, they could manipulate experiments and data to their hearts content and this is what they've got?
Follow @BOSsportschick on twitter
https://twitter.com/BOSsportschick
https://twitter.com/BOSsportschick
 RSS Feed